
Marketing Analytics
Let's face it, we all get so engrossed in doing the job that we often neglect to analyze if we are putting efforts in the right direction. Marketing is no…
Let’s face it, we all get so engrossed in doing the job that we often neglect to analyze if we are putting efforts in the right direction. Marketing is no different, but that’s what sets successful marketers apart. They adopt a strategy of continuous measurement and constant tuning to experiment with their spending and improve their returns.
Marketing Analytics is the practice of measuring and analyzing the performance of your marketing effort. It takes the guesswork out of what to do next by providing insights into what is working, what is not working, and where to spend more effort and money.
Analyzing Marketing Effort – ATL and BTL, Paid and Organic
The marketing team can engage in a wide set of initiatives and activities – each having its own goals. Depending on your product, target audience, marketing objective, and budget, a marketing campaign could be for ATL or BTL channels, cater to a video or a display or search platform, and can involve paid media or organic media. Let understand some of these first.
Paid Media or Organic Media
Organic Media doesn’t cost you any money. Examples include posting on your Facebook page or your Instagram account or when your brand appears in the search engine results due to searched keyword without paying for it. Paid media, on the other hand, involves spending money to post your ad. If you need to reach out to specific sections of an audience on Facebook who are not your followers, you need to pay Facebook for every impression shown or every click you get on your content.
A marketing team focuses on both organic and paid media. So even if you are not spending money on a channel, your marketing team might spend a lot of time and effort on organic channels. It can be curating the content and posting it to social media or optimizing your search engine ranking in organic search. As such, it is crucial to track how those efforts are working, and hence wholistic marketing analytics may track the impact of all the action, whether paid or organic
ATL and BTL Channels
ATL or above-the-line marketing involves a large user base and doesn’t target any specific audience. Examples include TV campaigns or radio ads. BTL or below-the-line marketing, on the other hand, is a more targeted campaign that typically includes social media ads or video ad or other such digital channels. It involves direct marketing strategies and focuses primarily on conversions rather than building brand awareness. This blog predominantly covers below-the-line channels. These channels include: –
- Display – This channel involves placing an ad next to content on websites, emails or other digital formats. The advertisements can be text, images, audio or video clips, animation, or other interactive content.
- Search – Most common channels are Google, Bing, Baidu Etc. A search channel can be:
- Organic search – People searching for your business by clicking on links in search engine results.
- Paid search – People clicking on the paid ad appearing on the search engine platform while searching for a keyword.
- Social Media – This includes social networks used by people for social interaction such as Facebook, Instagram, LinkedIn, blogs, etc.
- Video – Using videos as a format to market your product or services constitutes video marketing. Apart from YouTube, other social channels such as Facebook and Instagram also provide video formats for marketing.
- Email – This involves sending a promotional or informational marketing message to a list of email subscribers. This falls under the organization’s owned media and can cost much less than advertising on other paid media.
- SMS – SMS Marketing involves sending transactional messages and promotional campaigns using text messages. These messages primarily communicate time-sensitive offers and updates.
- Webinar/ Roadshows involves an Online seminar to educate your audience on your product, service, or information delivery.
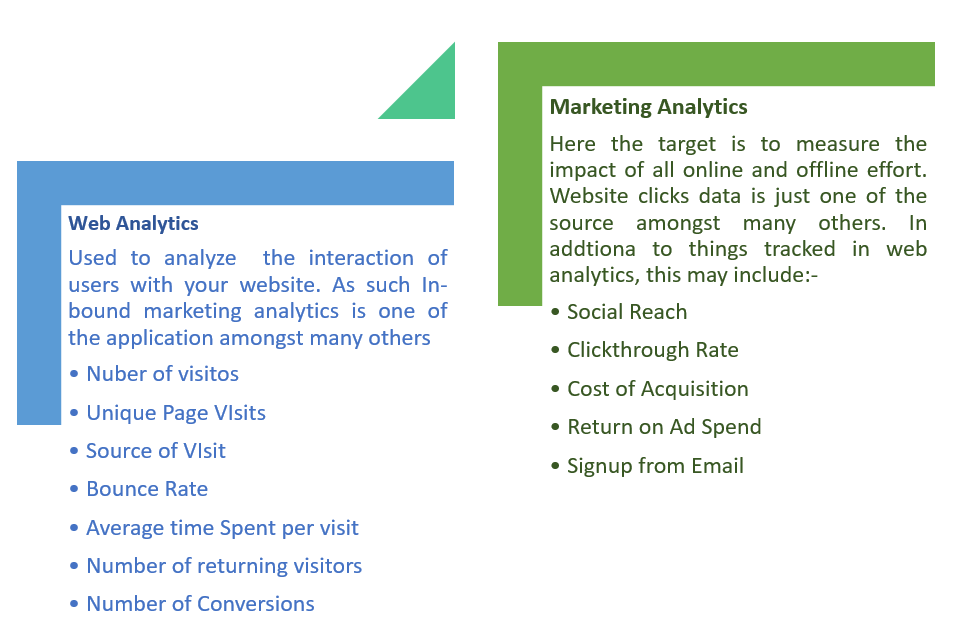
Approach for Marketing Analytics
One of the most common ways to quantify the impact of your marketing is to measure the performance of your website. Most of the digital marketing activities you do would directly result in people clicking on the ad and coming to your website. Many ads also include a tracking pixel which provides additional information about the campaign when clicked. Hence, web analytics can be one of the most logical ways to measure the marketing impact. Refer to our blog on web Analytics to know more about it.But there are many other components of marketing that may not get captured in web analytics. E.g., the impressions where people have looked at your ad but did not click on it. Impressions can play a significant role in creating visibility and increasing brand recall. Then there are other factors like timing of your campaign, duration of its running, money spent, the content used, and so on. Also, marketing may result in-store visits and conversion, which also forms a vital source to measure your impact.
Depending on your objective, you might want to either focus on web analytics or go beyond and integrate different data sources to get the data for the marketing effort, impressions, spend, and results across all the channels to understand the true impact and return.
Challenges for effective Marketing Analytics
An organization may be at a different stage of maturity in its marketing analytics journey. Many marketers start with an isolated approach. They generate insights on social media marketing from social media providers or aggregators, email marketing through the analytics provided by their email service provider, search marketing insights from the search platform, and so on. This can be a good starting point to know what is working in these individual channels. However, this fragmented approach can make it challenging to connect the dots and develop a holistic marketing strategy to optimize the marketing performance. One of the most cumbersome tasks in wholistic marketing analytics is to get data from multiple platforms such as email marketing, Google ads, etc., to create a seamless view. This is the most common reason why marketers shy away from getting into an in-depth analysis of their marketing tactics
At times, brands or agencies manually export the data out of their advertising platforms, such as Google ads or Facebook ads, and load this data in excel or some BI tools. This manual process can be extremely taxing, and you may spend most of the time integrating data rather than analyzing and using it for effective marketing. There are tools in the market that make it easy for you to get data from these different platforms. Click here to know more about these tools.
Marketing Analytics – What KPIs to track?
In digital marketing, two basic building blocks for tracking user interactions are impressions and clicks.
They form the basis for paid advertisements. Ad Clicks, or simply Clicks, is a marketing metric that counts the number of times users have clicked on a digital ad (whether image, link, video, text, or a button) to reach for more details.
Ad Impressions count the total number of times digital advertisements display on someone’s screen through any of the digital channels. Depending on your marketing approach, you may focus only on clicks and inbound website traffic or look at both, as suggested in this blog.
Apart from these, marketing analytics tracks numerous KPIs to analyze the effectiveness of your marketing. These KPIs may differ from channel to channel. E.g., You may want to monitor your reach and audience growth if you are working on a social media channel, but you may want to monitor your email bounce rate or email forward rate if you are looking at email marketing campaigns. Etc. There are certain other KPI’s which are more or less applicable to all channels. In this blog, we want to talk about some of these KPIs that help you maximize the marketing Impact and justify your effort and marketing spend. We feel these KPIs can roughly be grouped in 4 buckets as follows
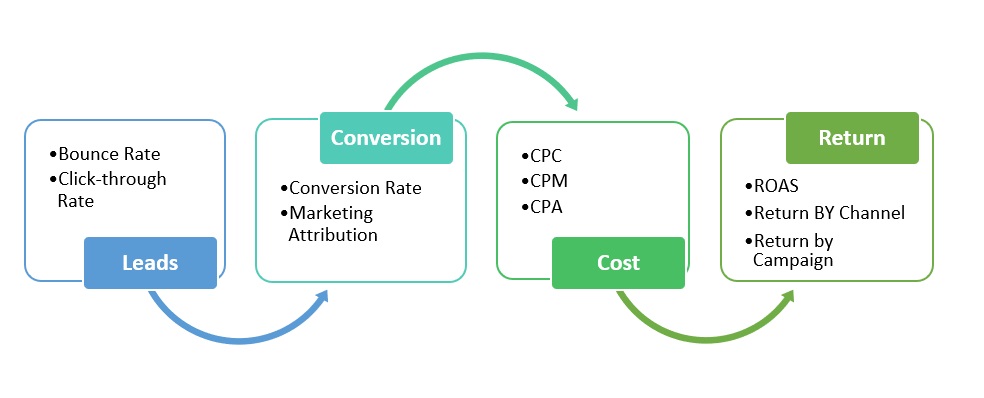
Leads – Quantifying the user interest
The first is to measure the Quality and Effectiveness of Your Ad or Email or Blog. The headline, Ad copy, Content, Images, everything can play a role here. One crucial KPI that you can use to track this is the click-through rate.
Click-Through Rate = Click-through rate is the ratio of users who click on a page to the total number of users who viewed that page
Low CTR may indicate a problem with the content of your ad. You might want to test different combinations of headlines, creative, Images, etc., to know where the problem is
Conversion – Quantifying the results
Your advert may be catchy and may generate an interest in the audience resulting in significant clicks. However, the next important thing to focus on is how many of these are getting converted. Conversions here can be any desired metric depending on the goal of your marketing campaign. It could be getting the user to buy a product, download a white paper, enroll for a trial, or any such desired action.
Conversion Rate is a good KPI to track the effectiveness of your landing page. So what does a low conversion rate metric indicate? There can be few possible reasons for low conversion:-
• Your site or landing page design is in-efficient
• Your call to action is not clear
• Your offer is no lucrative ( Too expensive or devoid of a value proposition)
Conversion Rate = The ratio of the number of users who completed the desired action after clicking on your ads to total click.
Cost – Tracking the spend
Another crucial area is to understand and compare the cost for marketing across channels. There are a bunch of KPIs you can track here, such as
CPC – Cost Per Click, Typically computed as the total cost incurred for marketing on social media divided by the number of resulting clicks.
CPM – Cost Per Mile or cost per 1000 impressions ( typically used for social media or display channels)
CPA – Cost associated with the conversion could be buying a product/ service or downloading an application, or any desired outcome.
CPA is perhaps the most important metric here. It gives you an estimate of how much new customers are costing you and whether your advertising strategy needs to be modified. Your objective, of – course, is to reduce the cost per acquisition to the lowest possible. It is also an excellent metric to compare the cost-effectiveness of a particular channel in acquiring a new customer.
Having a good idea of your CPA also helps you plan your marketing budget and spend across paid media channels. It also allows you to set a benchmark for your customer acquisition and enables you to keep a check on your marketing spend to acquire every new customer. The historical CPA also helps you in the bidding strategy to set the target price for your bids.
Returns – Analysing the impact
Your conversions are only valuable if the amount of revenue you generate from those customers exceeds the amount you spend on acquiring that customer.
Return on ad Spend (ROAS) = The ratio of total revenue generated from the advertising campaign to the total spend on that campaign.
It provides you with a complete, big-picture understanding of whether or not a campaign is paying off. There are scenarios when you are not focussing on conversion and revenue generation, such as when you’re focussing on building brand awareness. In such a situation, ROAS may not make sense. But in all the other marketing campaigns, you should keep track of the revenue and optimize your marketing approach to ensure higher ROAS.

You Might Be Interested In

Marketing Automation
Organizations with a sizable inflow of users on their website or mobile application grapple with the task of managing these leads for effective conversion. Users looking at your products/services may…

Marketing Data Integration
When it comes to analyzing marketing performance, organizations often focus only on web analytics insights, such as those provided by Google Analytics. But this can leave important marketing insights out…

Social Listening
According to the latest Digital Stat report by We Are Social, for the first time – 3.96 Billion people in the world, more than half of the world's total population…